A (Non-interactive) Shiny Presentation
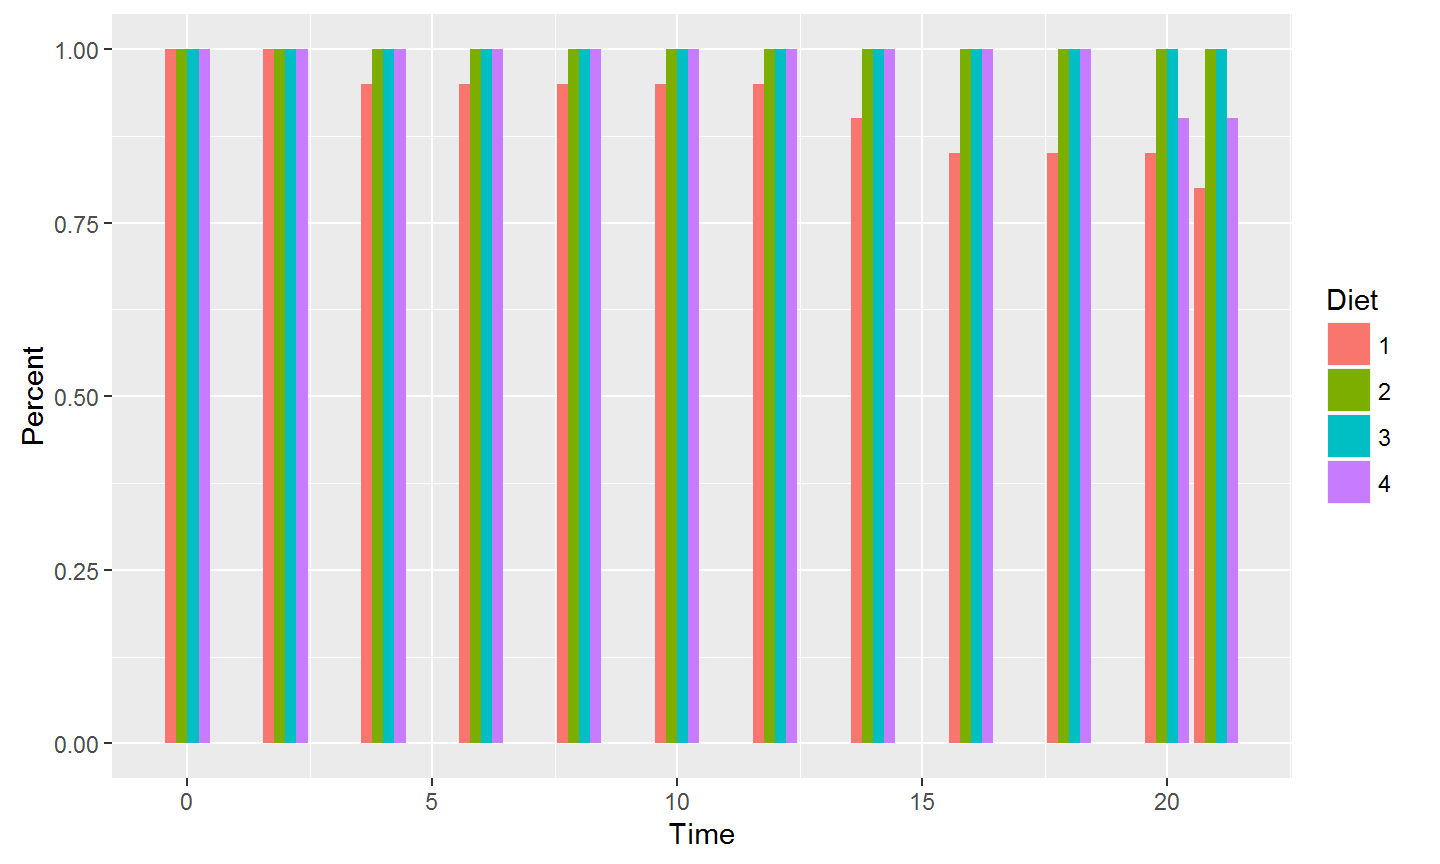
This is a practise presentation using shiny, ggplot and ggvis to explore the ChickWeight dataset.
Unfortunately the interactive shiny/ggvis parts don't work here, so it'll just be static for now.
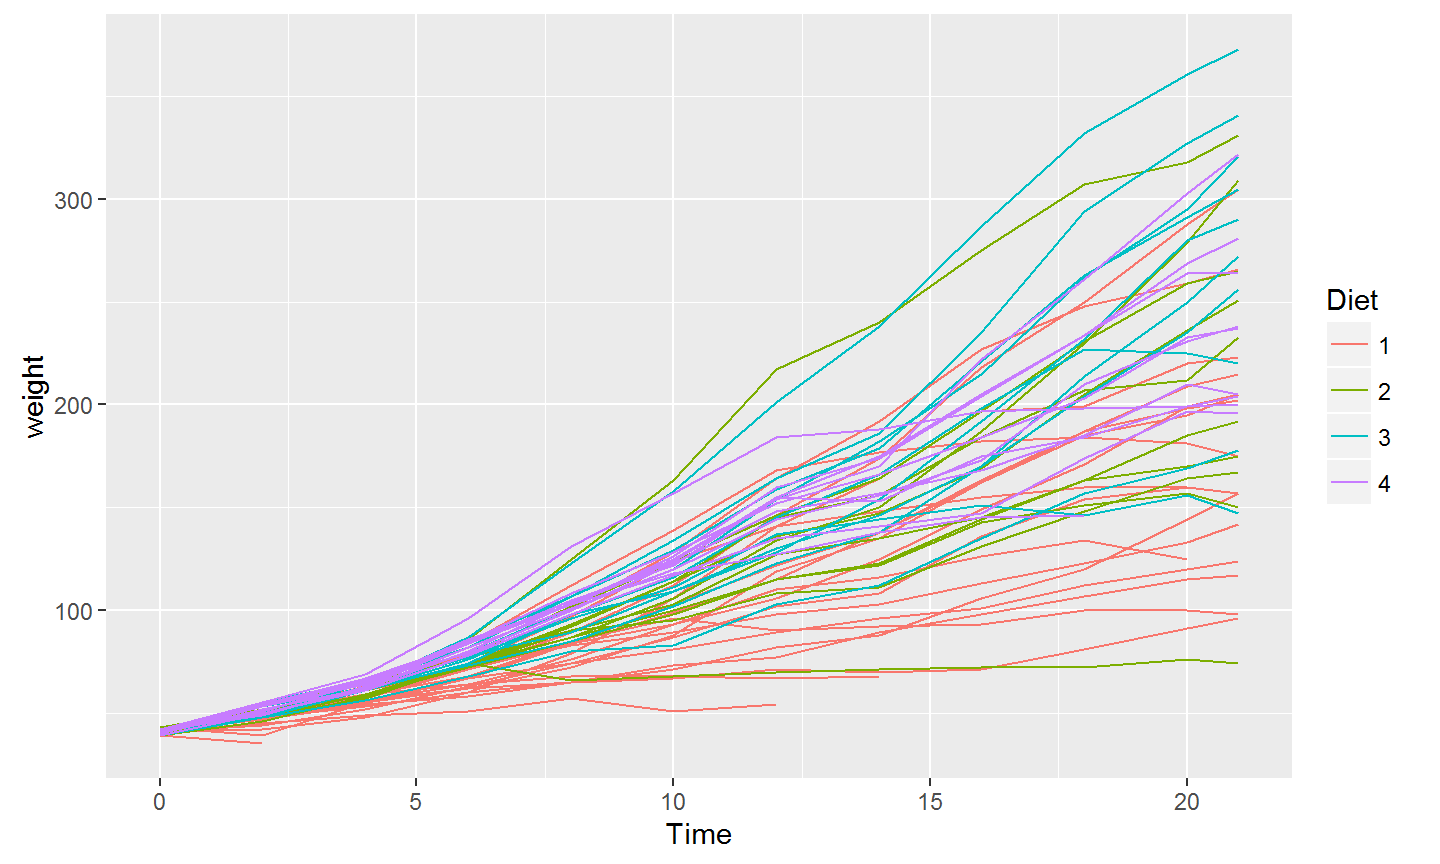
The ChickWeight dataset has 578 rows and 4 columns from an experiment on the effect of diet on early growth of chicks.
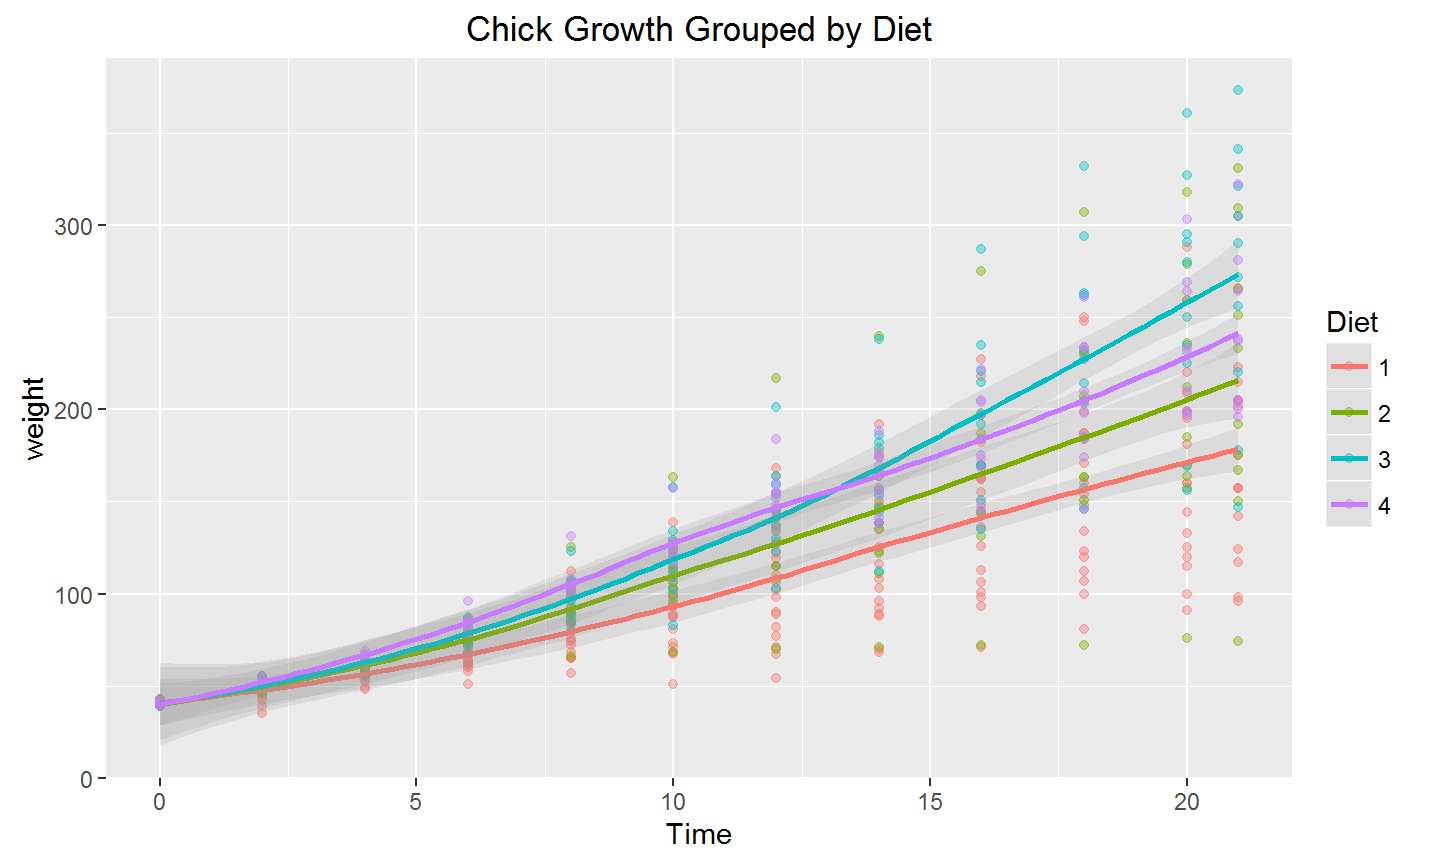
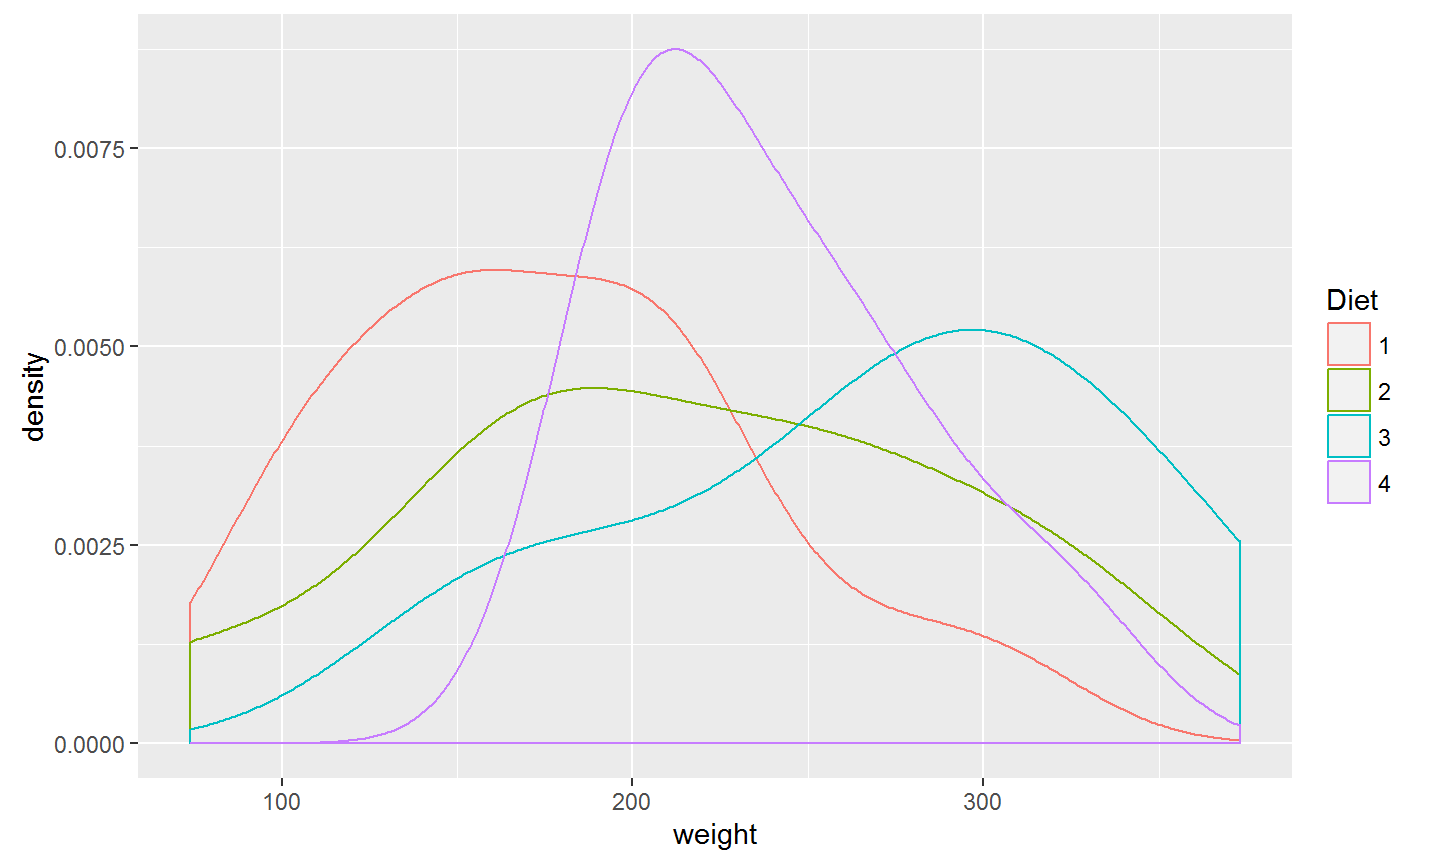
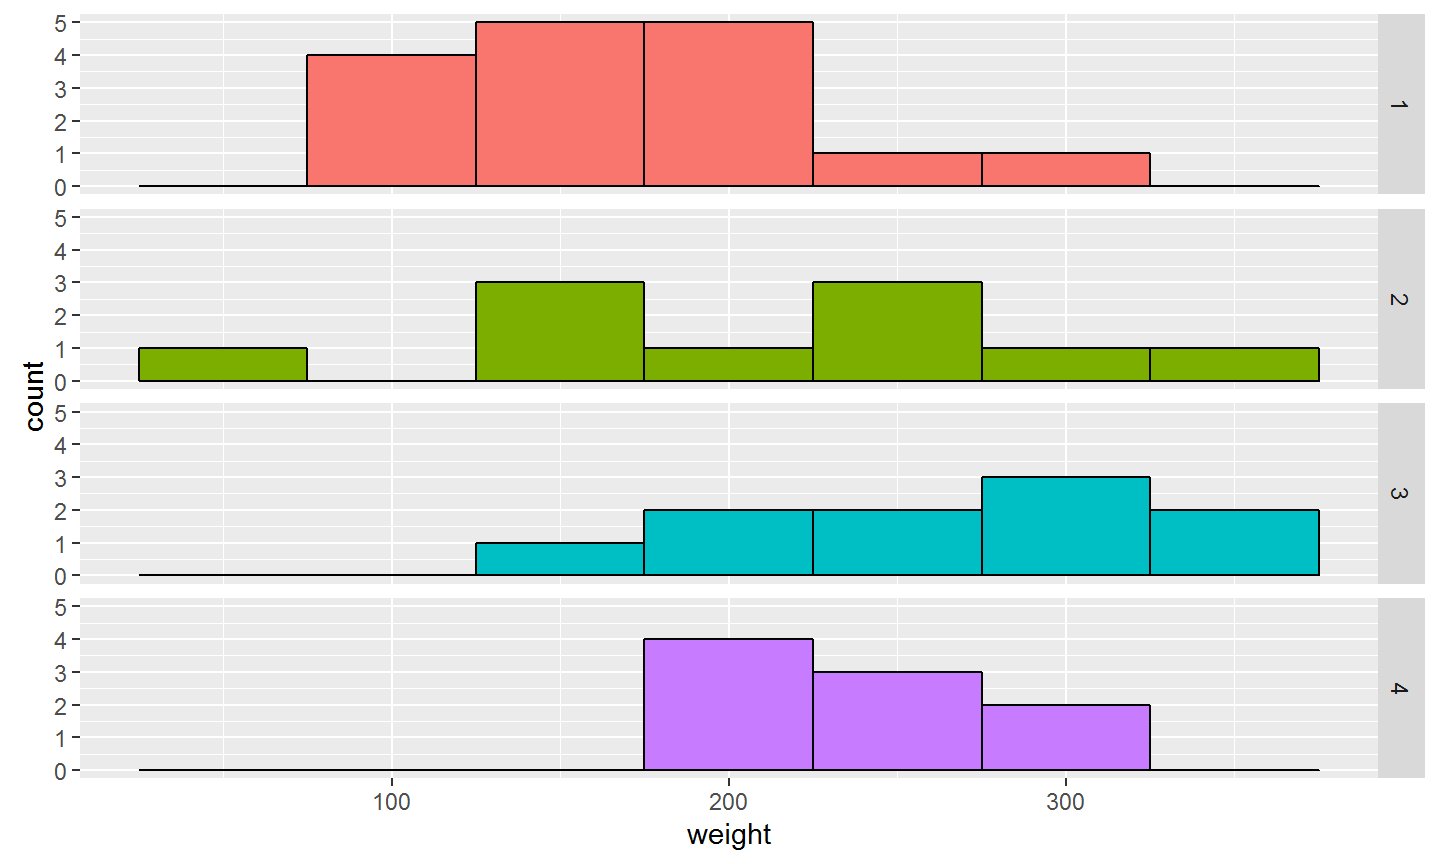
First we will explore the dataset and then we will compare the effect of diet on chick weight.
